This interactive map provides current air quality levels and health recommendations at the neighborhood level for the entire South Coast Air Quality Management District jurisdiction, which includes major portions of Los Angeles County, Orange County, San Bernardino County, and Riverside County including the Coachella Valley.
This map blends data from regulatory monitoring data operated by South Coast AQMD, hundreds of fine particle pollution sensors and a forecast model to generate air quality index values at more than 1,000 locations.
Many factors impact air quality in the Los Angeles metropolitan area including particulate pollution from vehicles, factories, refineries, household combustibles and wood burning. Other common sources include dust and wildfire smoke. Ozone and carbon monoxide pollution are also common although less visible.
Maps, Radar and Other Data
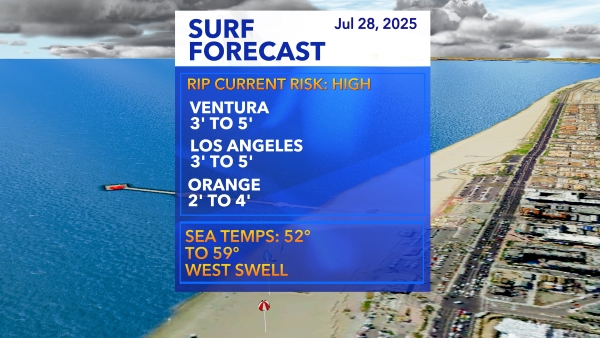
Surf Report (Stats by Solspot)
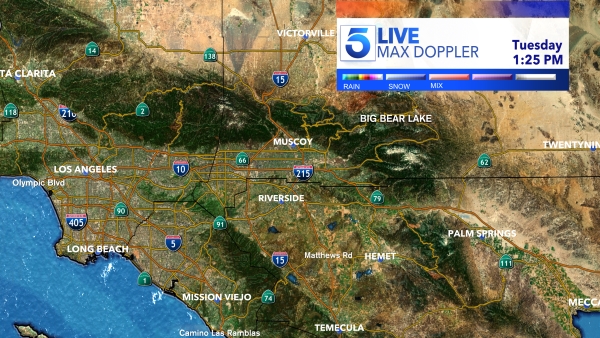
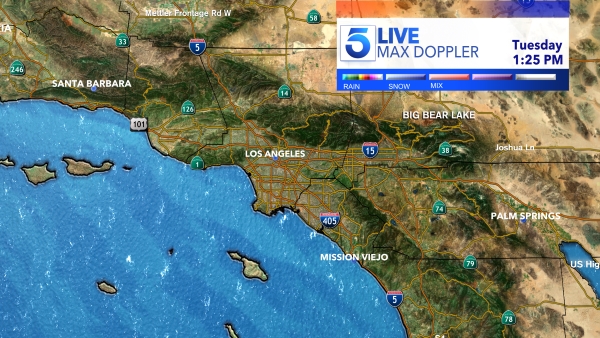
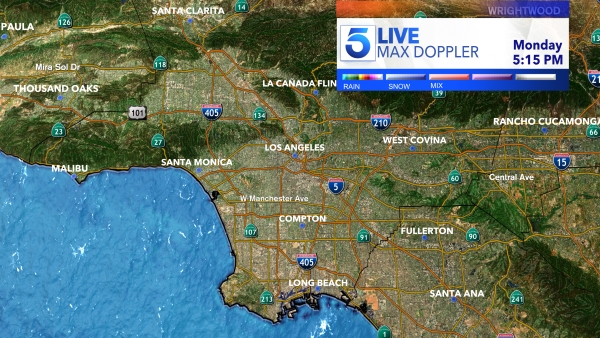
Los Angeles Virtual Doppler
Southwest Doppler Radar
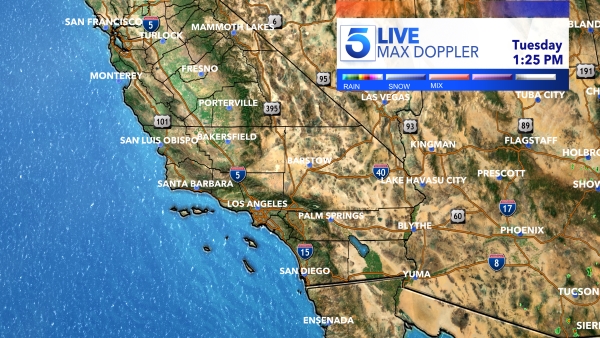
California Satellite Radar

Los Angeles Basin Radar
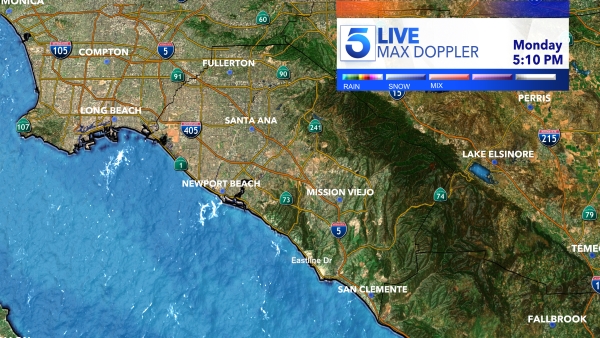
Orange County Radar
Inland Empire Radar